40 Statistics Interview Questions & Answers for Data Analysts
By William DavisSeptember 27, 2026

Statistics is a core skill for data analysts. You use it to describe data, spot patterns, compare groups, test ideas, measure uncertainty, and support business decisions. That's why statistics interview questions often appear alongside SQL, Excel, Python, data visualisation, and case study questions.
Interviewers don't always ask for complex maths. Many questions test whether you can explain a statistical idea in plain English and choose the right method for a real data problem.
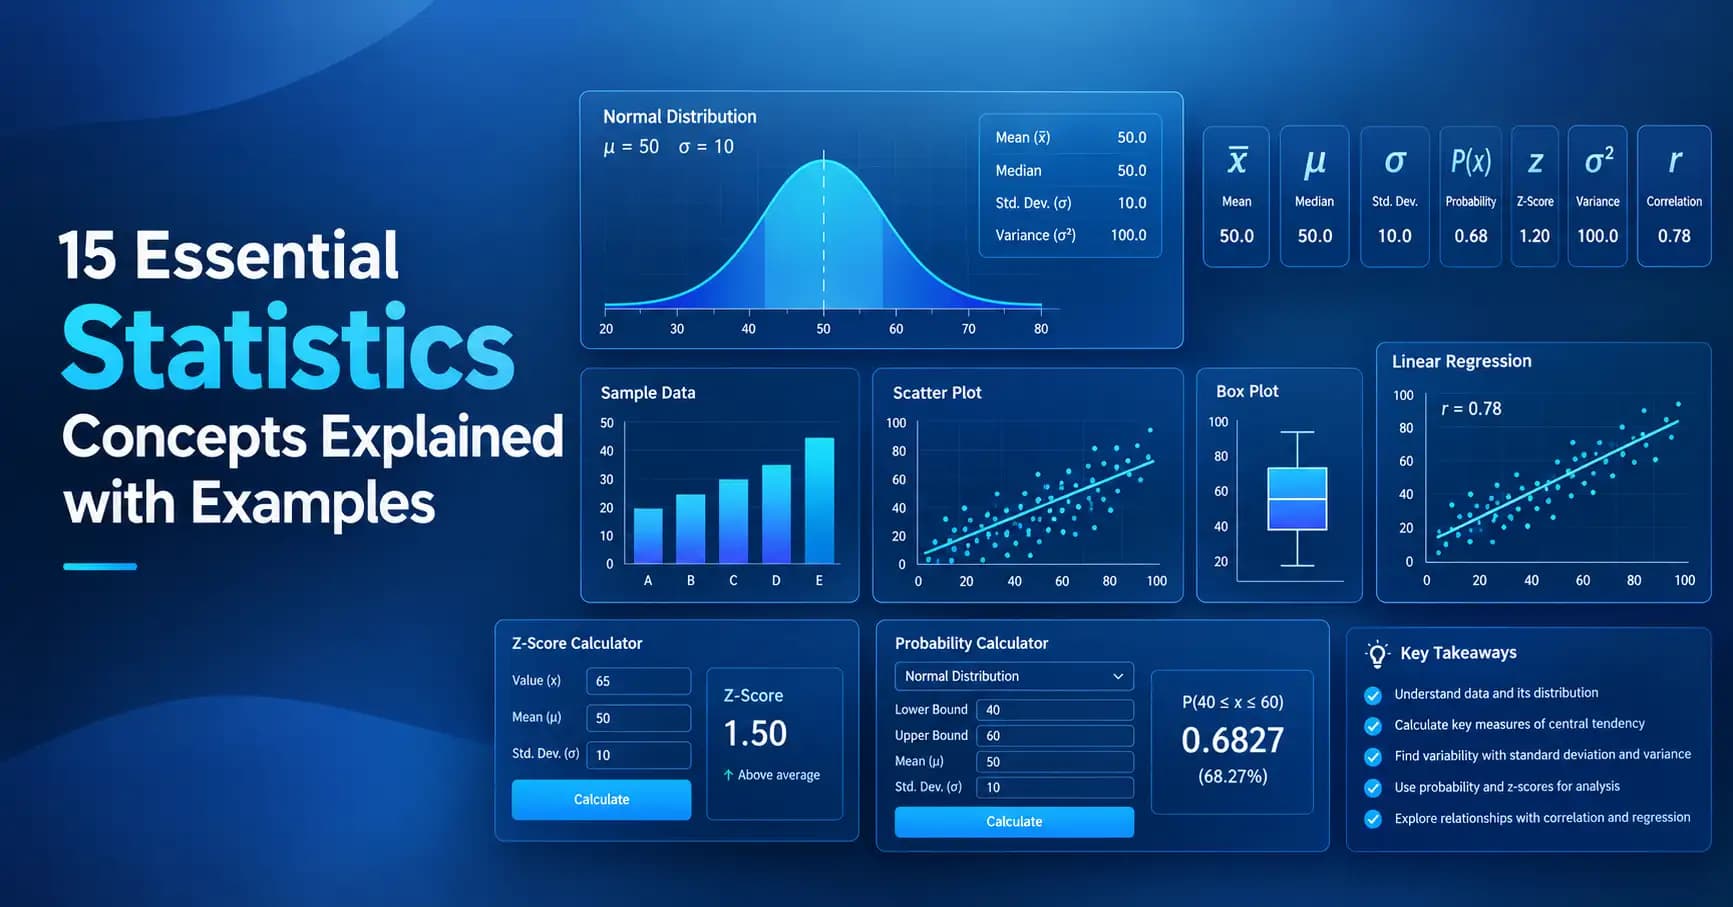
The questions below cover the areas that appear across popular statistics interview guides, including descriptive statistics, probability, distributions, sampling, hypothesis testing, confidence intervals, regression, A/B testing, and data quality.
Basic Statistics Interview Questions
These questions check whether you understand the building blocks of statistics. You should be able to answer them without relying on software.
1. What is the difference between descriptive and inferential statistics?
Answer: Descriptive statistics summarise the data you already have. Mean, median, standard deviation, tables, charts, and frequency counts are common examples.
Inferential statistics use sample data to learn about a larger population. Hypothesis tests and confidence intervals are common examples.
Example: If you calculate the average order value from all orders in your database, that's descriptive statistics. If you use a sample of customers to estimate the average order value for all future customers, that's inferential statistics.
2. What is the difference between a population and a sample?
Answer: A population is the full group you want to study. A sample is a smaller part of that group.
For example, all customers of an online store form the population. A random group of 1,000 customers is a sample.
Analysts often use samples because collecting data from every member of a population may be slow, costly, or impossible.
3. What is the difference between a parameter and a statistic?
Answer: A parameter describes a population, while a statistic describes a sample.
For example, the true average income of every customer in a population is a population parameter. The average income calculated from 500 sampled customers is a sample statistic.
We often use a sample statistic to estimate an unknown population parameter.
4. What are mean, median, and mode?
Answer: These are measures of central tendency.
Mean: Add all values and divide by the number of values.
Median: The middle value after sorting the data.
Mode: The value that appears most often.
For the values 2, 3, 3, 5, and 7, the mean is 4, the median is 3, and the mode is 3.
5. When would you use the median instead of the mean?
Answer: Use the median when extreme values may distort the mean.
Suppose five customers spend $20, $25, $30, $35, and $2,000. The mean is pulled far higher by the $2,000 purchase. The median gives a better picture of a typical order.
This is common when analysing income, house prices, delivery times, and purchase values.
6. What is variance, and how is it different from standard deviation?
Answer: Both measure how spread out data is around its mean.
Variance uses squared differences from the mean. Standard deviation is the square root of variance.
Standard deviation is often easier to explain because it uses the same unit as the original data. For example, if sales are measured in dollars, standard deviation is also measured in dollars.
7. What is the difference between range and interquartile range?
Answer: The range is:
Range = Maximum value - Minimum value
The interquartile range, or IQR, is:
IQR = Q3 - Q1
The range uses the two extreme values, so one unusual value can change it a lot. The IQR focuses on the middle 50% of the data and is less affected by extreme values.
8. What are quartiles and percentiles?
Answer: Quartiles divide ordered data into four parts.
Q1 is around the 25th percentile.
Q2 is the median, around the 50th percentile.
Q3 is around the 75th percentile.
Percentiles divide data into 100 parts. A customer at the 90th percentile for spending has a spending value higher than about 90% of the observations in the measured dataset.
9. What is skewness?
Answer: Skewness describes how much a distribution is not symmetric.
A right-skewed distribution has a longer tail on the right. A left-skewed distribution has a longer tail on the left.
For a right-skewed dataset, the mean is often greater than the median. Income data is a common example because a small number of very high incomes can pull the mean upward.
10. What are outliers, and how can you detect them?
Answer: An outlier is a value that is unusually far from the rest of the data.
One common rule uses the IQR:
Lower bound = Q1 - 1.5 × IQR
Upper bound = Q3 + 1.5 × IQR
Values outside these limits may be flagged as outliers.
You can also inspect scatter plots, box plots, z-scores, or business rules. An outlier is not always an error. It may be a real event that deserves attention.
Probability and Distribution Questions
Data analysts often work with uncertain outcomes. That's where probability and probability distributions become useful.
11. What is a frequency distribution?
Answer: A frequency distribution shows how often each value or group of values occurs.
For example, a sales dataset may show:
£0 to £49: 120 orders
£50 to £99: 240 orders
£100 to £149: 90 orders
A frequency table makes large datasets easier to inspect and can help reveal skew, gaps, or unusual patterns.
12. What is a probability distribution?
Answer: A probability distribution shows how possible values of a random variable are spread and how likely those values are.
There are two broad types:
Discrete distributions deal with countable outcomes, such as the number of support tickets.
Continuous distributions deal with values such as height, weight, or time.
Normal, binomial, and Poisson distributions are common examples discussed in statistics interviews.
13. What is a normal distribution?
Answer: A normal distribution is a symmetric, bell-shaped distribution.
In a normal distribution:
Mean = Median = Mode
A common rule says about 68% of observations fall within one standard deviation of the mean, about 95% within two, and about 99.7% within three. This is called the 68-95-99.7 rule.
14. What is a binomial distribution?
Answer: A binomial distribution models the number of successes in a fixed number of trials when each trial has two possible outcomes, such as success or failure.
For example, suppose an email campaign is sent to 100 people, and each person either opens the email or doesn't. The number of opens can be modelled with a binomial distribution when the model's assumptions are reasonable.
15. What is a Poisson distribution?
Answer: A Poisson distribution models the number of events that occur in a fixed interval when those events are treated as independent and have a stable average rate.
For example:
Support tickets received per hour
Calls received per minute
Website errors per day
The Poisson model is especially useful for count data.
16. What are marginal, joint, and conditional probability?
Answer: These describe probability in different ways.
Marginal probability looks at one event by itself, such as the probability a customer buys a product.
Joint probability looks at two events happening together, such as a customer buying Product A and Product B.
Conditional probability asks for the probability of one event given that another event has happened, written as P(A | B).
17. What is the Law of Large Numbers?
Answer: The Law of Large Numbers says that as the number of observations grows, the sample average tends to get closer to the expected value, assuming the usual conditions hold.
Think about repeatedly measuring the average result of a fair coin experiment. With a small number of trials, the result can move around a lot. With many trials, the average tends to settle near its expected value.
This idea matters when analysts work with large amounts of data.
18. What is the Central Limit Theorem?
Answer: The Central Limit Theorem, or CLT, says that under suitable conditions, the sampling distribution of the sample mean becomes closer to a normal distribution as sample size increases, even when the original population is not normal.
This helps explain why normal-based methods are so useful in statistical inference.
An interview answer should also mention that the CLT has conditions. Independence, an appropriate sampling process, and a sufficiently large sample are important.
19. What are the main sampling methods?
Answer: Common sampling methods include:
Simple random sampling: Each member has an equal chance of selection.
Systematic sampling: Select every kth member after a random start.
Stratified sampling: Divide the population into groups and sample from each group.
Cluster sampling: Divide the population into clusters and select some clusters.
The method should match the population and the purpose of the analysis.
20. What is sampling bias?
Answer: Sampling bias happens when the selected sample does not represent the target population.
For example, a company wants to measure satisfaction among all customers but surveys only people who used its premium support service. Those customers may have very different views from the full customer base.
Random or probability-based sampling methods can help reduce selection bias.
Hypothesis Testing Interview Questions
Many analyst interviews test whether you understand statistical evidence, not just whether you can produce a p-value.
21. What is standard error?
Answer: Standard error measures how much a sample statistic, such as a sample mean, would be expected to vary across repeated samples.
For a sample mean, a common formula is:
SE = s / √n
where s is the sample standard deviation and n is the sample size.
As sample size grows, the standard error usually becomes smaller. That means the estimate becomes more precise.
22. What is a confidence interval?
Answer: A confidence interval gives a range of plausible values for a population parameter based on sample data.
A 95% confidence interval is not the claim that there is a 95% probability that a fixed parameter lies in one already calculated interval. In repeated sampling, the method is designed so that about 95% of such intervals contain the true parameter, under the model assumptions.
23. What is the difference between a confidence interval and a prediction interval?
Answer: A confidence interval estimates uncertainty around a population quantity, such as an average response.
A prediction interval is for a future individual observation.
Prediction intervals are usually wider because they include uncertainty in the estimated mean plus the natural variation of individual observations.
This difference is useful in forecasting and regression work.
24. What is hypothesis testing?
Answer: Hypothesis testing is a method for assessing whether sample data provides enough evidence against a null hypothesis.
A simple process is:
Define the null and alternative hypotheses.
Choose a significance level.
Select an appropriate test.
Calculate the test statistic and p-value.
Draw a conclusion based on the chosen rule.
Interviewers often want to see that you understand the logic, not just the formula.
25. What is a p-value?
Answer: A p-value is the probability of getting a test result at least as extreme as the observed result, assuming the null hypothesis is true.
A small p-value can provide evidence against the null hypothesis, but it does not tell you the size of the effect.
It also does not mean "the probability that the null hypothesis is true." That's a common interview mistake.
26. What is the significance level?
Answer: The significance level, written as α, is the threshold chosen before a hypothesis test.
A common choice is 0.05. With α = 0.05, a p-value below or equal to 0.05 is often treated as statistically significant under the chosen test setup.
The threshold should be set based on the context and the cost of errors, not changed after seeing the result.
27. What are Type I and Type II errors?
Answer:
Type I error: Rejecting a true null hypothesis. This is a false positive.
Type II error: Failing to reject a false null hypothesis. This is a false negative.
For example, imagine a test for whether a new feature improves conversion.
A Type I error would mean concluding that the feature helps when it doesn't. A Type II error would mean missing a real improvement.
28. What is statistical power?
Answer: Statistical power is the probability that a test will detect an effect when a real effect exists.
Power depends on factors such as:
Sample size
Significance level
Variation in the data
Higher sample size often increases power. This matters when planning experiments because a weak test may miss a useful effect.
29. What is the difference between a z-test and a t-test?
Answer: Both tests can be used to test means, but their assumptions and use cases differ.
A z-test is commonly linked with situations where the population standard deviation is known or where large-sample approximations are appropriate.
A t-test is commonly used when the population standard deviation is unknown and the estimate comes from the sample.
The choice should depend on the study design, data, and assumptions rather than a simple sample-size rule.
30. What is a chi-square test?
Answer: A chi-square test is often used with categorical data.
Two common uses are:
Test of independence: Check whether two categorical variables are associated.
Goodness-of-fit test: Compare observed counts with expected counts.
For example, an analyst could test whether customer plan type is related to whether a customer churned.
Advanced Statistics Questions for Data Analysts
These questions move closer to the kind of reasoning you may use in business analysis, experimentation, and predictive work.
31. What is ANOVA?
Answer: ANOVA, or Analysis of Variance, is used to compare the means of three or more groups.
Suppose a business tests three pricing plans and wants to compare average revenue per customer. ANOVA can test whether there is evidence that at least one group mean differs.
If the overall test is significant, a post-hoc test can help identify which groups differ.
32. What are non-parametric tests?
Answer: Non-parametric tests are statistical tests that do not rely on the same distribution assumptions as many traditional parametric tests.
Examples include:
Mann-Whitney U test
Wilcoxon signed-rank test
Kruskal-Wallis test
Chi-square test
They can be useful when data does not meet the assumptions needed for a parametric method, depending on the question and study design.
33. What is correlation?
Answer: Correlation measures the strength and direction of the relationship between two variables.
Pearson's correlation coefficient ranges from -1 to +1.
+1: Perfect positive linear relationship
0: No linear correlation
-1: Perfect negative linear relationship
Correlation tells you about association. It does not prove that one variable causes the other.
34. What is the difference between correlation and causation?
Answer: Correlation means two variables move together in some way. Causation means a change in one variable produces a change in another.
For example, ice cream sales and sunburn cases may rise at the same time. That does not mean ice cream causes sunburn. Hot weather can affect both.
To study cause and effect, analysts may use controlled experiments, A/B tests, or causal inference methods.
35. What is regression analysis?
Answer: Regression is used to study the relationship between a dependent variable and one or more independent variables.
A simple linear regression can be written as:
y = β₀ + β₁x + ε
Here:
y is the outcome
x is the predictor
β₀ is the intercept
β₁ is the coefficient
ε is the error term
Data analysts use regression for tasks such as estimating sales, understanding drivers of churn, and measuring relationships between business variables.
36. What are residuals in regression?
Answer: A residual is the difference between an observed value and the value predicted by the model.
Residual = Observed value - Predicted value
For a good linear model, residual checks can help you find patterns, unequal variance, unusual observations, or other problems with the model assumptions.
A residual plot is often useful when reviewing regression results.
37. How do you interpret a regression coefficient?
Answer: A regression coefficient shows the expected change in the dependent variable for a one-unit increase in the related predictor, while holding the other model variables constant, assuming the model is set up appropriately.
For example, if the coefficient for advertising spend is 2.5, the model estimates a 2.5-unit increase in the outcome for each one-unit increase in advertising spend, with other included variables held constant.
38. What is multicollinearity?
Answer: Multicollinearity happens when two or more predictor variables in a regression model are strongly related to each other.
For example, a model might include both annual salary and monthly salary. Those variables contain almost the same information.
High multicollinearity can make coefficient estimates unstable and make it harder to understand the separate effect of each predictor.
39. What is A/B testing?
Answer: A/B testing compares two versions of something, such as a landing page, email, or app feature.
A common setup is:
A: Existing version
B: New version
Users are randomly assigned to groups, and the analyst compares a chosen outcome such as conversion rate.
A good A/B test needs a clear success metric, suitable sample size, sound randomisation, and care with repeated testing and other sources of bias.
40. How should you handle missing data?
Answer: Start by finding out why data is missing. Missing values can be grouped as MCAR, MAR, or MNAR, depending on the missingness process.
You should not fill every blank with the mean without checking the data first.
Possible approaches include:
Removing rows when the amount of missing data is small and the choice is justified
Mean, median, or mode imputation for suitable cases
K-nearest neighbours
Multiple imputation
Model-based methods
The right choice depends on why the data is missing, the amount of missing data, and how the analysis will be used. Poor handling can change the results and introduce bias.
How to Answer Statistics Questions in a Data Analyst Interview
Knowing the definition is only part of the job. A strong interview answer shows that you can apply the idea.
For most statistics questions, use this simple pattern:
Define it → explain why it matters → give a small example.
For example, don't stop at:
"A confidence interval gives a range for a population parameter."
Add a practical explanation:
"For example, if I estimate average order value from a sample, the confidence interval helps show the uncertainty around that estimate."
You should also be ready to discuss assumptions. A statistical method can give a neat number while still being a poor choice for the data.
Common mistakes to avoid
Don't say that a p-value is the probability that the null hypothesis is true.
Don't say that correlation proves causation.
Don't assume every outlier should be deleted.
Don't choose a statistical test based only on sample size. Check the data, research question, study design, and assumptions.
Don't confuse statistical significance with business importance. A very small effect can be statistically significant with a large sample, while a useful effect may fail to reach significance with too little data.
Final Thoughts
These 40 statistics interview questions cover the main concepts a data analyst should know, from mean, median, variance, and probability to hypothesis testing, regression, A/B testing, and missing data.
The best way to prepare is not to memorise one-line definitions. Practise explaining each concept with a simple business example. Be ready to say what the method does, when you'd use it, what assumptions matter, and how you'd explain the result to a non-technical manager.
That approach will help you handle both direct statistics interview questions and practical data analysis scenarios.