Understanding Standard Deviation in Simple Terms
By William DavisJanuary 20, 2026
Quick Answer
Standard deviation tells you how spread out your data is from the average.A small standard deviation means most numbers are close to the average. A large one means the numbers are scattered far apart. It's like measuring how "wild" or "tame" your data behaves.
Imagine you're comparing test scores from two classes. Both classes have an average score of 75. Does that mean they performed the same? Not necessarily! One class might have scores ranging from 70 to 80, while another might have scores ranging from 50 to 100. That's where standard deviation comes in handy.
Standard deviation is one of the most common concepts in statistics. It helps you understand the "typical" distance between each data point and the average. By the end of this article, you'll know what standard deviation means, how to calculate it, and when to use it in real life. No complex math background needed. We'll keep things simple.
What Is Standard Deviation?
Standard deviation measures how much individual values differ from the mean (average). Think of it as a "spread meter" for your data. When values cluster tightly around the average, you get a low standard deviation. When values scatter widely, you get a high one.
Here's a simple way to think about it. Picture a dartboard. If all your darts land close together near the bullseye, that's low standard deviation (consistent throws). If your darts scatter all over the board, that's high standard deviation (inconsistent throws). The bullseye represents your average, and standard deviation shows how far your actual throws landed from it.
Real-World Examples of Standard Deviation:
- • Weather: Daily temperatures with low SD are predictable; high SD means wild swings
- • Finance: Stocks with high SD are volatile and risky
- • Manufacturing: Product measurements with low SD mean consistent quality
- • Sports: Athletes with low SD in performance are reliable
- • Grades: Class scores with high SD show big differences between students
The symbol for standard deviation is σ (sigma) for populations and s for samples. You'll see these symbols everywhere in statistics. Don't let them intimidate you. They just represent the same concept applied to different data sets.
How to Calculate Standard Deviation Step by Step
Calculating standard deviation might sound scary, but it follows a logical process. Let's break it down into five simple steps using a real example.
σ = √[Σ(x - μ)² / N]
Standard Deviation Formula
Example:Let's find the standard deviation of these five test scores: 70, 80, 85, 90, 75.
Step 1: Find the Mean (Average)
Add all values and divide by the count.
(70 + 80 + 85 + 90 + 75) ÷ 5 = 400 ÷ 5 = 80
Step 2: Find Each Deviation from the Mean
Subtract the mean from each value.
70-80=-10, 80-80=0, 85-80=5, 90-80=10, 75-80=-5
Step 3: Square Each Deviation
This removes negative signs and emphasizes larger differences.
100, 0, 25, 100, 25
Step 4: Find the Average of Squared Deviations (Variance)
Add the squares and divide by the count.
(100 + 0 + 25 + 100 + 25) ÷ 5 = 250 ÷ 5 = 50
Step 5: Take the Square Root
This brings us back to the original units.
√50 = 7.07
Population vs Sample Standard Deviation
This is an important difference that trips up many students. The calculation changes slightly depending on whether you're analyzing an entire population or just a sample from it.
Population Standard Deviation (σ)
- • Use when you have ALL the data
- • Divide by N (total count)
- • Example: All employee salaries at a small company
- • Symbol: σ (sigma)
σ = √[Σ(x - μ)² / N]
Sample Standard Deviation (s)
- • Use when you have a SUBSET of data
- • Divide by (N-1) for accuracy
- • Example: Survey of 100 customers out of millions
- • Symbol: s
s = √[Σ(x - x̄)² / (n-1)]
Why divide by (N-1) for samples?When you take a sample, you're estimating the population's spread. Samples tend to underestimate variability slightly. Dividing by (N-1) corrects this bias and gives you a better estimate of the true population standard deviation.
In practice, most real-world scenarios involve samples. Unless you're measuring every single item in a population (rare), you'll use sample standard deviation. For large samples (100+), the difference between dividing by N and (N-1) becomes negligible anyway.
The 68-95-99.7 Rule (Empirical Rule)
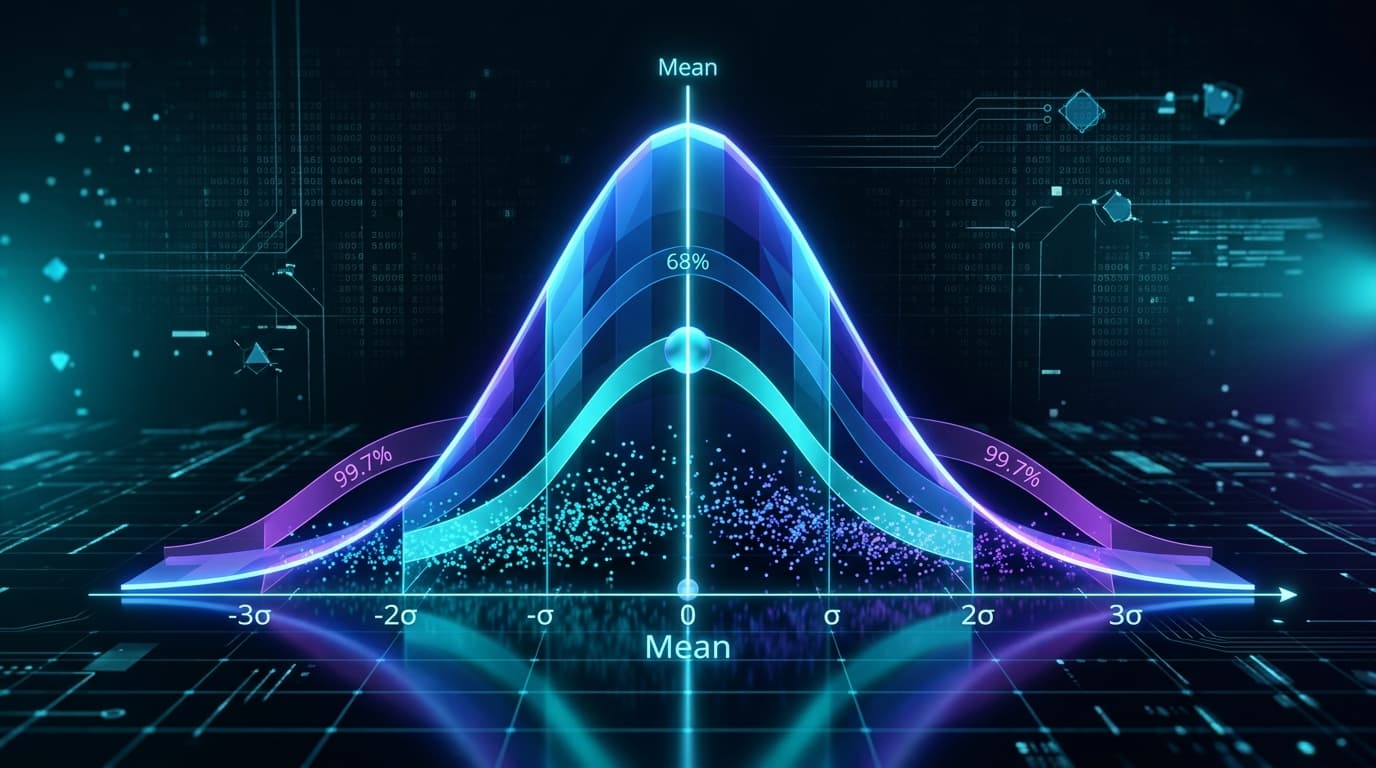
Once you know the standard deviation, you can predict where most of your data falls. The empirical rule (or 68-95-99.7 rule) works for data that follows a normal distribution (bell curve). This is one of the most practical applications of standard deviation.
The Empirical Rule States:
The Empirical Rule (68-95-99.7 Rule) in Normal Distributions
Exact distribution of observations within 1, 2, and 3 standard deviations from the population mean (μ)
Practical Example: Adult male heights in the US have a mean of about 70 inches with a standard deviation of 3 inches.
- • 68% of men are between 67" and 73" (70 ± 3)
- • 95% of men are between 64" and 76" (70 ± 6)
- • 99.7% of men are between 61" and 79" (70 ± 9)
This rule helps identify outliers too. If someone is 6'8" (80 inches), they're more than 3 standard deviations above average. That's quite rare! Only about 0.15% of the population would be that tall. Standard deviation gives you a way to understand how unusual any particular value is.
How Standard Deviation Connects to Z-Tests
Standard deviation is a key part of z-tests. In fact, you can't perform a z-test without knowing the standard deviation. Here's why this matters and how the two concepts work together.
A z-test helps you determine if a sample mean is significantly different from a population mean. The z-score formula uses standard deviation to standardize your data:
z = (x̄ - μ) / (σ / √n)
Z-score formula for hypothesis testing
Notice the σ (standard deviation) in the denominator. It's divided by √n to create the "standard error," which accounts for sample size. A larger sample means a smaller standard error, making it easier to detect real differences.
Why Standard Deviation Matters in Z-Tests:
- High SD: More variation means you need bigger differences to be significant
- Low SD: Less variation means even small differences might be meaningful
- Unknown SD: If you don't know σ, use a t-test instead
Understanding standard deviation helps you read z-test results better. A z-score of 2.5 means your sample mean is 2.5 standard deviations away from the population mean. That's a notable difference that likely didn't happen by chance.
Common Mistakes to Avoid
Even experienced analysts make these mistakes. Here's what to watch out for when working with standard deviation:
❌ Confusing Standard Deviation with Variance
Variance is the square of standard deviation. They're related but not the same. Standard deviation is in the original units; variance is in squared units.
❌ Using Population Formula for Sample Data
Always divide by (n-1) for samples, not n. This seems minor but significantly affects small sample calculations.
❌ Ignoring Outliers
One extreme value can inflate standard deviation dramatically. Always check for outliers before interpreting results.
❌ Comparing Standard Deviations of Different Units
You can't directly compare SD of heights (inches) with SD of weights (pounds). Use coefficient of variation for comparisons.
Frequently Asked Questions
What is a "good" standard deviation?
There's no universal "good" value. It depends on your context. For quality control, lower is usually better (consistency). For investment portfolios, higher SD means higher risk but potentially higher returns. Always compare SD relative to the mean and your specific goals.
Can standard deviation be negative?
No, standard deviation can never be negative. Since we square all deviations before averaging, and then take the square root, the result is always zero or positive. A standard deviation of zero means all values are identical.
What's the difference between standard deviation and standard error?
Standard deviation measures spread within a single sample. Standard error measures how much sample means would vary if you took multiple samples. Standard error equals standard deviation divided by the square root of sample size (SE = SD/√n).
When should I use standard deviation vs range?
Range (max minus min) is simpler but only uses two values. Standard deviation uses all data points, making it more reliable and informative. Use range for quick estimates; use standard deviation for serious analysis or when outliers might skew results.
How does sample size affect standard deviation?
Larger samples generally give more stable standard deviation estimates closer to the true population value. Small samples can have highly variable SD calculations. For reliable results, aim for at least 30 data points when possible.
Conclusion: Put Standard Deviation to Work
Standard deviation is your window into data variability. Now that you understand it, here's what to remember:
- ✓ Standard deviation measures spread (how far data points typically fall from the average)
- ✓ Low SD means consistency; high SD means variability
- ✓ Use population SD (σ) for complete data; sample SD (s) for subsets
- ✓ The 68-95-99.7 rule helps you understand where most data falls
- ✓ Standard deviation powers z-tests and other statistical analyses
Ready to apply what you've learned? Try our Z-Test Calculatorto see standard deviation in action. Whether you're a student checking homework, a researcher testing hypotheses, or an analyst working with data, understanding standard deviation gives you a practical skill you'll use often.
Statistics doesn't have to be intimidating. With concepts like standard deviation broken down into simple terms, you're well on your way to becoming more confident with data. Keep practicing, and soon these calculations will become second nature!