When Should You Use a Z-Test Instead of a T-Test?
By William DavisJanuary 6, 2026
Quick Answer
Use a z-test when you have a large sample (n ≥ 30) and know the population standard deviation. Use a t-test when you have a small sample (n < 30) or don't know the population standard deviation. Most real-world studies use t-tests because population parameters are rarely known.
What's the Real Difference Between Z-Tests and T-Tests?
Both tests help you decide if your sample data shows a real effect or just random chance. They answer questions like: "Is this medicine actually better?" or "Did our marketing change improve sales?"
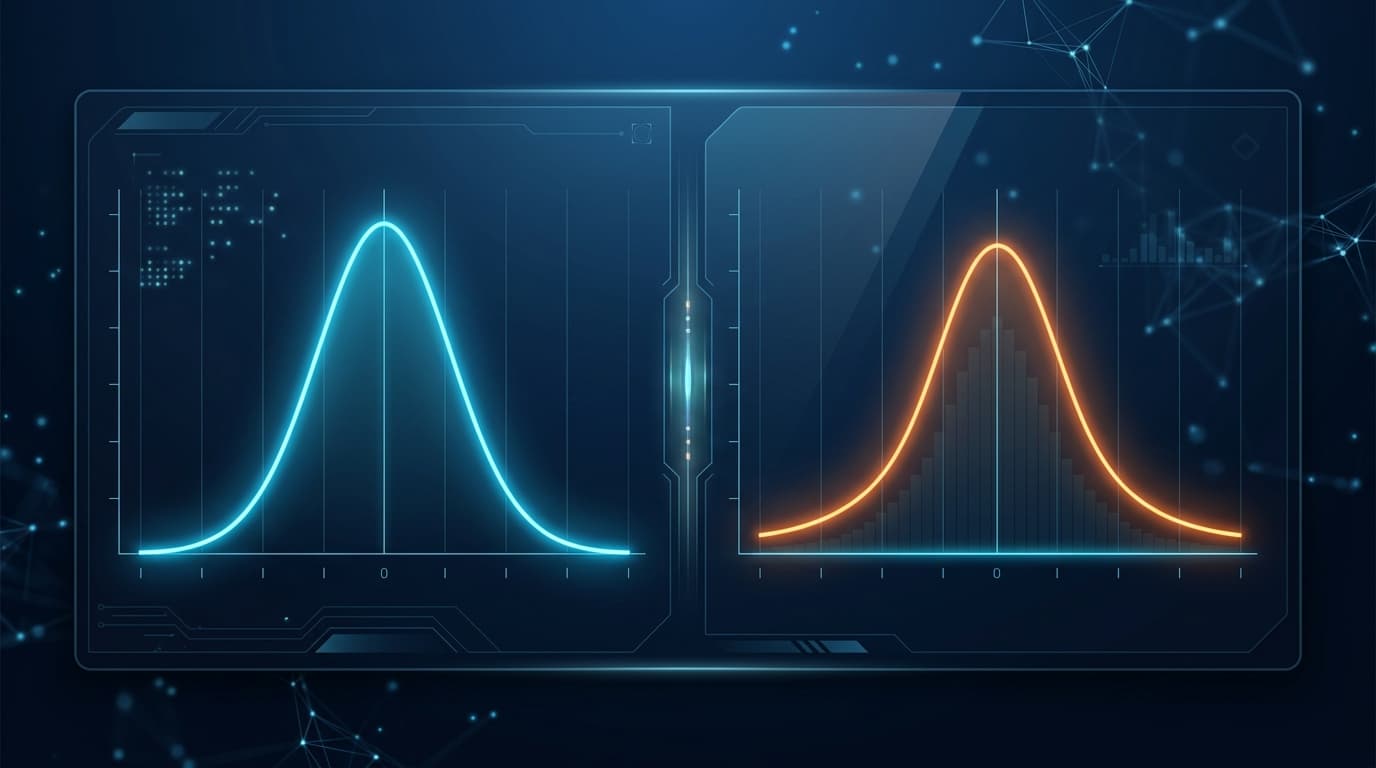
The main difference? They use different probability distributions. A z-test assumes your data follows a perfect bell curve (normal distribution). A t-test is more flexible—it works even when you're less certain about your data's shape.
Here's a real example: You're testing if a new teaching method improves test scores. You have 100 students (large sample) and you know the standard deviation from past years. That's a z-test situation. But if you only have 15 students and don't know the exact population standard deviation? You need a t-test.
Why Two Different Tests?
William Gosset invented the t-test in 1908 while working at Guinness Brewery. He needed to test small batches of beer but couldn't use the z-test (which requires large samples). His t-test accounts for extra uncertainty in small samples. Today, researchers use it for most studies because it's more practical than assuming you know the exact population standard deviation.
Z-Distribution (Standard Normal) vs Critical Rejection Regions
Critical cutoffs at z = ±1.96 define the two-tailed rejection region (α = 0.05). As sample size increases (n ≥ 30), Student's t-distribution converges directly to this standard normal curve.
When to Use Z-Test vs T-Test
Use a Z-Test When:
- Sample size is 30 or more (n ≥ 30)
- You know the population standard deviation (σ)
- Data is roughly normally distributed
- Testing proportions from large samples
- Quality control with known standards
Use a T-Test When:
- Sample size is less than 30 (n < 30)
- You don't know the population standard deviation
- Data might not be perfectly normal
- Most real-world research situations
- Medical trials and experiments
Important Rule of Thumb
When in doubt, use a t-test. It's safer and works in more situations. The t-test will give you nearly the same results as a z-test when your sample is large, but it also protects you when your sample is small. Most statistical software defaults to t-tests for this reason.
The Formulas (Simple Version)
Z-Test Formula
Why it works: The formula measures how far your sample mean is from the expected population mean, adjusted for sample size. Larger samples give more accurate estimates, so the denominator gets smaller (more precise).
T-Test Formula
Why it works: The formula looks identical to the z-test, but it uses sample standard deviation (s) instead of population standard deviation (σ). This adds extra uncertainty, which is why t-distributions have "fatter tails" than normal distributions—there's more chance of extreme values.
Key difference: The only formula difference is σ vs s. But that small change makes a big difference in interpretation. The t-test is more conservative (harder to reject the null hypothesis) when samples are small, which protects against false positives.
Real Example: Choosing Between Z-Test and T-Test
Scenario: Testing Student IQ Scores
A researcher wants to test if students in a special program have higher IQ scores than the general population. The general population IQ has a mean of 100 and a known standard deviation of 15.
Given Data:
- • Sample size: 40 students
- • Sample mean: 105
- • Population mean: 100
- • Population standard deviation: 15 (known from past research)
1Choose the Right Test
We have 40 students (n ≥ 30) and we know the population standard deviation (σ = 15). This meets the requirements for a z-test.
2Calculate the Standard Error
Standard Error = σ / √n = 15 / √40 = 15 / 6.32 = 2.37
3Calculate the Z-Score
z = (x̄ - μ) / (σ / √n) = (105 - 100) / 2.37 = 5 / 2.37 = 2.11
4Find the P-Value
For z = 2.11, the p-value is about 0.035 (3.5%). This means there's only a 3.5% chance of seeing this result if the special program had no effect.
✓Conclusion
Since p-value (0.035) is less than 0.05, we reject the null hypothesis. The special program students do have significantly higher IQ scores than the general population.
What if We Only Had 20 Students?
If the sample size were only 20 students (n < 30), we'd use a t-test instead. The t-test would give us a slightly larger p-value (around 0.041) because it's more conservative with small samples. The conclusion would likely stay the same, but the t-test protects against overconfidence.
Also, if we didn't know the population standard deviation (15), we'd have to use the sample standard deviation and run a t-test regardless of sample size.
How to Use the Z-Test Calculator
Our Z-Test Calculator makes it easy to run hypothesis tests without manual calculations. Here's how to use it step by step.
Select Your Test Type
Choose one-sample z-test (comparing one group to a known mean), two-sample z-test (comparing two groups), or proportion z-test (testing percentages).
Set Your Significance Level
Most studies use α = 0.05 (5%). This means you're willing to accept a 5% chance of a false positive. For stricter testing, use 0.01.
Choose Your Alternative Hypothesis
Pick two-tailed (testing if there's any difference), right-tailed (testing if it's higher), or left-tailed (testing if it's lower).
- • Two-tailed: "Is it different?"
- • Right-tailed: "Is it higher?"
- • Left-tailed: "Is it lower?"
Enter Your Data
Input your sample statistics. The calculator validates your inputs in real-time.
- • Sample mean (average of your data)
- • Population mean (the value you're testing against)
- • Population standard deviation (must be known)
- • Sample size (number of observations)
Review Your Results
The calculator shows your z-score, p-value, critical value, confidence interval, and a plain-English conclusion. All results update instantly as you type.
Common Mistakes to Avoid
- • Using z-test when you don't actually know the population standard deviation
- • Forgetting to check if your sample size is large enough (n ≥ 30)
- • Choosing the wrong tail (two-tailed vs one-tailed)
- • Entering standard deviation instead of variance (or vice versa)
- • Ignoring whether your data is roughly normally distributed
How to Interpret Your Results
Understanding Your Z-Score
The z-score tells you how many standard deviations your sample mean is from the expected population mean. Here's what different z-scores mean:
Z-score between -1.96 and 1.96
Not statistically significant at α = 0.05. Your result could easily happen by chance. Don't reject the null hypothesis.
Z-score between 1.96 and 2.58 (or -1.96 and -2.58)
Statistically significant at α = 0.05 but not at α = 0.01. Moderate evidence against the null hypothesis.
Z-score beyond ±2.58
Highly significant even at α = 0.01. Strong evidence against the null hypothesis. Very unlikely to happen by chance.
Understanding Your P-Value
The p-value is the probability of seeing your result (or more extreme) if the null hypothesis is true. Lower p-values mean stronger evidence against the null hypothesis.
P-value < 0.01 (1%)
Very strong evidence. Result is highly significant.
P-value between 0.01 and 0.05
Strong evidence. Result is statistically significant at the standard level.
P-value between 0.05 and 0.10
Weak evidence. Marginally significant. You might want more data.
P-value > 0.10
No significant evidence. Result could easily happen by chance.
What to Do Next
If your result is significant (p < 0.05):
- • Look at the confidence interval to see the practical size of the effect
- • Consider whether the difference is large enough to matter in practice
- • Think about replicating the study to confirm your findings
- • Report your results honestly, including effect size
If your result is not significant (p ≥ 0.05):
- • Don't claim there's "no effect"—you just didn't find strong evidence
- • Consider whether your sample size was large enough
- • Check if your data meets the test assumptions
- • Think about collecting more data if possible
Important Limitations to Know
Both z-tests and t-tests have important limitations. Understanding these helps you interpret results correctly and avoid common mistakes.
Z-Tests Rarely Work in Real Life
You almost never know the true population standard deviation in real research. Even if you have historical data, populations change over time. This is why most statistical software defaults to t-tests.
Both Tests Assume Normality
Your data should be roughly normally distributed (bell-shaped). If your data is highly skewed or has extreme outliers, these tests can give misleading results. With large samples (n ≥ 30), the Central Limit Theorem helps, but it's not magic.
They Don't Measure Practical Importance
A statistically significant result doesn't mean it's practically important. With a huge sample, even tiny differences become "significant." Always look at the effect size and confidence interval, not just the p-value.
Independence Matters
These tests assume your observations are independent. If you measured the same person multiple times, or if your data has clusters (like students within classrooms), you need different methods.
Different Calculators Give Different Results
Small differences in rounding, degrees of freedom calculations, or how ties are handled can cause slight variations between calculators. These differences are usually tiny and don't change your conclusions.
When These Tests Don't Work
Consider alternative methods if:
- • Your data is clearly non-normal and sample size is small (use nonparametric tests)
- • You have repeated measures or matched pairs (use paired t-test instead)
- • You have more than two groups to compare (use ANOVA instead)
- • Your data has extreme outliers that can't be removed
- • Your sample size is very small (n < 15) and data isn't normal
Real-World Applications
Education
- Testing if a new teaching method improves test scores
- Comparing graduation rates between schools
- Evaluating student performance against national standards
- Analyzing SAT score changes after tutoring
Healthcare & Medicine
- Testing if a drug reduces blood pressure
- Comparing recovery times between treatments
- Evaluating infection rates in hospitals
- Analyzing patient satisfaction scores
Business & Marketing
- A/B testing website conversion rates
- Comparing sales before and after a promotion
- Testing if customer satisfaction improved
- Analyzing employee productivity metrics
Scientific Research
- Testing experimental vs control groups
- Analyzing survey results from large populations
- Comparing measurement accuracy between methods
- Evaluating gender differences in psychology studies
Frequently Asked Questions
Why is my result different from another calculator?
Small differences can come from rounding, different precision levels, or slightly different formulas for edge cases. These differences are usually tiny (like 0.047 vs 0.048 for p-value) and won't change your conclusions. If you see large differences, double-check that you entered the same values in both calculators.
Can I use a z-test with a sample size of 25?
Only if you truly know the population standard deviation (which is rare). Even then, a t-test is safer because it accounts for the uncertainty in small samples. The rule of n ≥ 30 is a guideline, not an absolute law, but it's there to protect you from unreliable results.
What if my p-value is exactly 0.05?
This is right on the border. Technically, p = 0.05 means you'd reject the null hypothesis, but it's a weak result. Consider collecting more data, looking at the confidence interval, and thinking about practical significance. Don't make major decisions based on borderline p-values.
Do z-tests and t-tests give the same result with large samples?
Yes! As sample size increases, the t-distribution approaches the normal distribution. With n ≥ 100, the results are nearly identical. This is why you can safely use a t-test even when a z-test might technically apply—the results will be almost the same.
Is a z-test better than a t-test?
No, neither is "better." They're appropriate for different situations. A t-test is more versatile and works in more real-world scenarios. A z-test is fine when its assumptions are met, but those assumptions (especially knowing σ) rarely hold in practice. When in doubt, use a t-test.
What if my data isn't normally distributed?
If your sample is large (n ≥ 30), the Central Limit Theorem helps—the sampling distribution of the mean will be approximately normal even if your data isn't. If your sample is small and clearly non-normal, consider nonparametric tests like the Mann-Whitney U test or Wilcoxon signed-rank test instead.
Should I always use α = 0.05?
Not necessarily. The 0.05 threshold is a convention, not a law of nature. In fields where false positives are very costly (like medical diagnosis), use α = 0.01. In exploratory research, you might use α = 0.10. Choose your significance level before you collect data, not after looking at results.
Ready to Run Your Z-Test?
Use our free Z-Test Calculator to get instant results with step-by-step explanations. No registration required.
Try the Calculator Now