How to Choose the Right Statistical Test for Your Research Study
By William DavisOctober 19, 2026
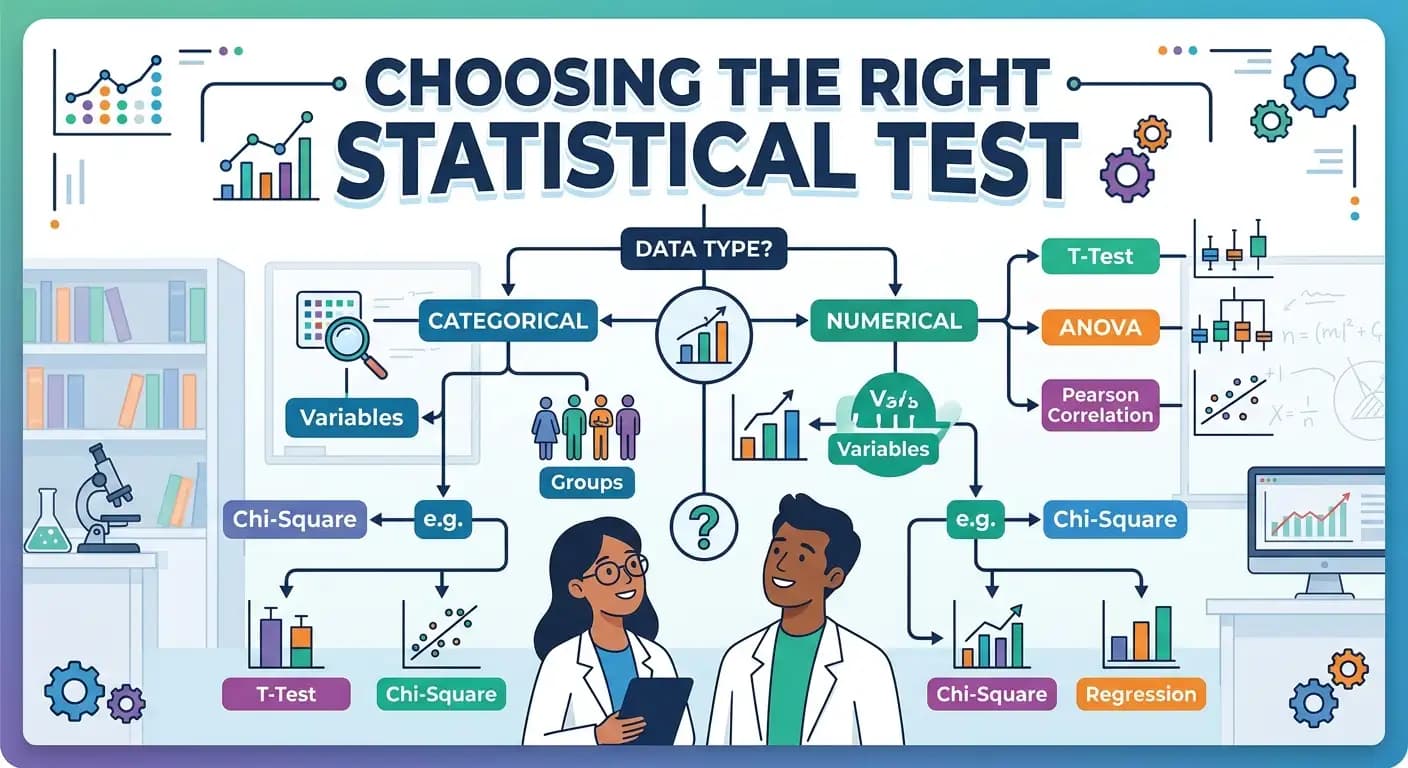
Choosing the right statistical test can feel confusing, especially when you are new to research. There are many options, including t-tests, ANOVA, chi-square tests, correlation, and regression. Each method answers a different type of question.
You do not need to memorise every statistical test. You can narrow your options by understanding your research question, the type of data you collected, and how your study was designed.
This guide explains how to choose a statistical test step by step. It includes common research examples, a quick-reference table, and practical tips for interpreting results.
What Is a Statistical Test?
A statistical test is a method used to analyse data and answer a research question. It helps researchers assess whether an observed difference or relationship provides evidence against an assumption.
For example, a researcher may want to know whether a new teaching method improves exam results, or whether age is related to income. Statistical tests help answer these questions by analysing the collected data.
Many tests use a p-value to assess how compatible the observed results are with a specified null hypothesis. The null hypothesis usually assumes there is no difference, relationship, or effect of interest.
A statistical test does not automatically prove that a research hypothesis is true. Interpret results alongside the study design, effect size, uncertainty, and relevant assumptions.
5 Things to Consider Before Choosing a Statistical Test
Before selecting a test, answer these five questions.
1. What Is Your Research Question?
Start by deciding what you want to find out. Many research questions involve one of these goals:
- Comparing groups: Do two or more groups have different average scores?
- Finding relationships: Are two variables associated?
- Predicting outcomes: Can one or more variables help predict an outcome?
- Comparing proportions: Do groups have different rates of an outcome?
- Studying changes: Did measurements change after an intervention?
Your research objective is the first clue to the right method. Comparing students' exam results across two teaching methods is different from investigating whether study time is related to exam results. Even with the same variables, the research question can lead to a different analysis.
2. What Type of Data Have You Collected?
The type of data influences which tests are appropriate.
Numerical data represent quantities that can be measured or counted. Examples include exam marks, age, income, height, and reaction time. Numerical data can be continuous, such as height, or discrete, such as the number of books someone owns.
Categorical data describe groups or categories. Examples include gender categories, product types, education levels, and treatment outcomes. Categorical data may have two categories, such as pass or fail, or several categories, such as different occupations.
Ordinal data have a meaningful order, but the gaps between categories are not necessarily equal. Satisfaction ratings from very dissatisfied to very satisfied are one example.
This distinction matters because a test designed for numerical measurements may not suit every categorical or ordinal variable.
3. How Many Groups Are You Comparing?
If your study compares groups, identify how many are involved. You might compare one group with an expected value, two groups using different teaching methods, three treatment groups, or several age groups.
A test designed for two independent groups is not automatically suitable for comparing three or more groups. The number of groups narrows your options, but you must also consider the outcome and whether observations are independent.
4. Are the Groups Independent or Paired?
This is one of the most important decisions in statistical analysis.
Independent groups contain different participants. For example, one group of students uses traditional teaching methods, while another uses an online learning programme.
Paired or related data come from linked observations. For example, researchers measure the same students' exam scores before and after a teaching programme.
These situations need different approaches because measurements from the same person are usually related. A paired test accounts for this relationship. Treating paired observations as independent can lead to incorrect conclusions.
5. Do Your Data Meet the Test's Assumptions?
Consider the assumptions of the test before interpreting results. Common assumptions include:
- Independence: Observations fit the test's independence requirements.
- Normality: The relevant data, differences, or model residuals are approximately normal where required.
- Equal variances: Groups have similar variability when the selected test requires this.
- Sample size: The study has enough information for reliable estimates.
- Appropriate measurement: Variables are measured on a scale that suits the analysis.
Not every test requires all these conditions. For example, Welch's t-test allows unequal population variances when comparing two independent group means.
If your data do not meet an assumption, you may need another version of the test, a suitable alternative, or a statistical model that accounts for the study design.
Statistical Test Selection Table
This table is a starting point for common research situations. Your final choice also depends on assumptions, sampling, variables, and the effect you want to estimate.
| Research question | Common statistical test |
|---|---|
| Is one group mean different from a known value? | One-sample t-test |
| Are the means of two independent groups different? | Welch's independent-samples t-test |
| Did the same participants' mean scores change over time? | Paired-samples t-test |
| Do three or more independent groups differ in their means? | ANOVA or Welch's ANOVA |
| Do three or more related measurements differ? | Repeated-measures ANOVA |
| Are two categorical variables associated? | Chi-square test of independence |
| Are categorical counts too small for a reliable chi-square approximation? | Fisher's exact test may be appropriate |
| Is there a relationship between two numerical variables? | Pearson or Spearman correlation |
| Can one or more variables predict a numerical outcome? | Linear regression |
| Can variables predict a yes-or-no outcome? | Logistic regression |
| Is there a difference in paired binary outcomes? | McNemar's test |
| Are two groups different on an ordinal or ranked outcome? | Mann-Whitney U test may be appropriate |
| Are three or more independent groups different on an ordinal or ranked outcome? | Kruskal-Wallis test may be appropriate |
| Are two related conditions different on ranked data? | Wilcoxon signed-rank test may be appropriate |
| Does the study examine time until an event occurs? | Survival analysis |
This table covers common situations, not every possible design. The final choice depends on your assumptions, sampling method, variables, and the specific effect you want to estimate.
Common Statistical Tests and When to Use Them
Understanding what each test does makes the selection process easier.
1. T-Test
A t-test is commonly used to investigate differences in means. Choose the version that matches how the data were collected.
- One-sample t-test: Compare a sample mean with a reference value. For example, test whether a product's average battery life differs from its advertised eight hours.
- Independent-samples t-test: Compare the means of two separate groups. For example, compare exam scores for students taught using two methods. Welch's t-test is often a sensible choice because it does not require equal population variances.
- Paired-samples t-test: Compare linked measurements, such as the same participants' scores before and after an intervention.
2. ANOVA
ANOVA, or analysis of variance, is commonly used to compare means across three or more groups. For example, a researcher may compare exam scores among students taught using classroom lessons, online lessons, and blended learning.
A significant ANOVA result indicates evidence that at least one group mean differs. It does not tell you which groups differ. Follow-up comparisons may be needed, with an appropriate adjustment for multiple comparisons. Standard ANOVA and Welch's ANOVA have different assumptions, so match the version to the study and data.
3. Chi-Square Test
A chi-square test is commonly used with categorical data. The chi-square test of independence examines whether two categorical variables are associated.
For example, a researcher may investigate whether product preference is associated with age group by comparing counts for each product within each age group. When expected counts are too small for a reliable chi-square approximation, Fisher's exact test may be a better option for a suitable table.
An association does not prove that one variable causes the other.
4. Correlation
Correlation measures the strength and direction of an association between two variables.
Pearson correlation measures the strength of a linear relationship between numerical variables. It can be influenced by extreme values and is most useful when a linear relationship describes the data reasonably well.
Spearman correlation measures a monotonic relationship using ranked values. It can suit ordinal data or relationships that are not well described by a straight line.
A researcher might use correlation to examine whether study time is associated with exam marks. Correlation does not prove causation. A third factor may influence both variables, or the association may have another explanation.
5. Regression Analysis
Regression is useful when you want to explain or predict an outcome using one or more variables.
Linear regression is commonly used when the outcome is numerical, such as exam marks or monthly sales. Logistic regression is commonly used when the outcome has two categories, such as whether a customer purchases a product.
A researcher may use regression to investigate whether study time, attendance, and previous grades help predict final exam marks. Including more variables does not automatically eliminate bias or establish a causal relationship.
6. Nonparametric Tests
Nonparametric tests can be useful when data are ordinal, heavily skewed, or unsuitable for a particular parametric method. Common examples include:
- Mann-Whitney U test for comparing two independent groups using ranks.
- Wilcoxon signed-rank test for suitable paired or related data.
- Kruskal-Wallis test for comparing three or more independent groups using ranks.
- Friedman test for comparing three or more related conditions.
These tests are not assumption-free, and they do not always test the same question as a t-test or ANOVA. For example, the Mann-Whitney U test does not automatically test whether two group medians differ. That interpretation needs additional conditions about the distributions.
Do not choose a nonparametric test only because your sample is small or a normality test is significant. Consider the research question, measurement scale, distribution, and assumptions together.
A Step-by-Step Example of Choosing the Right Test
Imagine a researcher wants to find out whether a new teaching method improves students' exam performance. The researcher collects scores from students who used the new method and students who used the traditional method.
- Define the research question. The researcher wants to know whether the average exam scores differ between the two groups.
- Identify the outcome variable. Exam scores are numerical measurements.
- Identify the number of groups. There are two groups: students using the new method and students using the traditional method.
- Check whether the groups are independent or paired. If students in each group are different people, the groups are independent. If the same students are measured before and after the change, the observations are paired.
- Check assumptions and study design. Consider independence, outliers, sample size, and the data distribution. For independent group means, consider whether a method that allows unequal variances is appropriate.
- Select the test. For two independent groups with numerical scores, Welch's independent-samples t-test is a reasonable starting point when the question concerns the difference in means. For the same students measured before and after, a paired-samples t-test may be suitable if its assumptions are reasonable.
- Interpret the results. Examine the estimated difference, its confidence interval, and the p-value. Consider whether the difference matters in practice.
This process helps ensure the selected test matches the question and the way the data were collected.
What If Your Data Do Not Meet the Assumptions?
Finding that your data do not meet an assumption does not mean your research has failed. First understand which assumption is not met and whether it affects the planned analysis.
If two independent groups have different variances, Welch's t-test may be more suitable than the standard pooled-variance t-test. If an outcome is ordinal, a rank-based method may better fit the measurement scale. If participants are measured repeatedly, a paired or repeated-measures method may account for the relationship between observations. If observations are clustered, such as students within schools, you may need a model that accounts for clustering.
Look at plots and summaries of the data. Check for data-entry mistakes and unusual observations. Do not remove valid observations just because they make the results less significant.
Avoid trying many methods and choosing the one that produces the smallest p-value. The research question and a defensible analysis plan should guide your choice.
Common Mistakes to Avoid When Choosing a Statistical Test
- Choosing a test without defining the research question: Decide whether you are comparing groups, studying an association, or predicting an outcome first.
- Ignoring paired data: Measurements from the same people are not generally independent. Use a method that accounts for the study design.
- Assuming every numerical variable is normally distributed: Check the relevant assumptions for your method. Normality of residuals or within-group data may matter in different ways depending on the analysis.
- Choosing a test based only on sample size: Sample size matters, but so do measurement type, group structure, and research objective.
- Treating correlation as proof of causation: Two variables can be associated without one causing the other.
- Reporting only the p-value: A p-value does not show effect size or practical importance. Include an effect estimate and confidence interval where appropriate.
- Running many tests without adjustment: Repeated testing can increase the chance of false-positive findings. Plan primary analyses in advance and consider suitable adjustments for multiple comparisons.
- Confusing statistical significance with practical importance: A small difference can be significant in a large sample. A meaningful difference may be estimated imprecisely in a small study.
How to Report Your Statistical Test in a Research Paper
Describe your analysis clearly enough for readers to understand what you did. A good statistical report usually identifies:
- The test and why it was selected.
- The groups or variables analysed.
- The sample size and relevant descriptive statistics.
- The test statistic, degrees of freedom where applicable, and p-value.
- The effect estimate and confidence interval where appropriate.
- Important assumptions, corrections, or adjustments.
For example:
“An independent-samples Welch's t-test was used to compare mean exam scores between the two teaching groups. The difference in means was reported with a 95% confidence interval and a p-value.”
This is a reporting template, not a result from an actual study. Replace it with the correct details from your own analysis. Follow your university, journal, or discipline's reporting guidelines, since different fields may have additional requirements.
Frequently Asked Questions
How do I choose a statistical test for my research?
Start with your research question and identify the outcome variable. Determine whether your data are numerical, categorical, or ordinal. If you are comparing groups, identify their number and whether they are independent or paired. Then check the relevant assumptions and choose a test that fits your goal.
Which statistical test should I use for two groups?
It depends on the outcome and study design. For two independent groups with numerical outcomes, an independent-samples t-test may be suitable. For the same participants measured twice, a paired-samples t-test may be appropriate. Categorical outcomes may need a chi-square test, Fisher's exact test, or a method for paired binary data.
Which statistical test should I use for three or more groups?
For numerical means across three or more independent groups, ANOVA or Welch's ANOVA may be appropriate. For three or more related measurements, repeated-measures ANOVA or the Friedman test may be suitable. The right choice depends on the data and assumptions.
What is the difference between parametric and nonparametric tests?
Parametric tests use a specified statistical model and often focus on parameters such as population means. Nonparametric methods often use ranks or other approaches with fewer distributional assumptions. Neither is always better. Choose the method that fits your question, data, and assumptions.
Can I choose a statistical test based on sample size alone?
No. Sample size affects precision and reliability, but you must also consider the outcome variable, number of groups, study design, independence, and assumptions.
What should I do if I am unsure which statistical test to use?
Write down your research question, identify the variables, and explain how the data were collected. A statistical decision guide can narrow down the options. For complex designs, clustered data, repeated measurements, or consequential analyses, ask a statistician or research supervisor before finalising the method.
Does a statistically significant result prove my hypothesis?
No. Statistical significance indicates that the result is sufficiently inconsistent with the null hypothesis under the chosen test's assumptions and significance threshold. It does not establish causation, guarantee that a finding is important, or prove your hypothesis is true.
Final Thoughts
Choosing the right statistical test becomes easier when you focus on the question you want to answer instead of memorising a long list of methods.
Define the research objective, identify the data type, determine whether groups are independent or paired, and check the assumptions. Then estimate the effect you care about and interpret the result in the context of your research design.
When a study has a complex design or the choice is unclear, seek advice from a qualified statistician. A carefully chosen method makes findings easier to explain, report, and evaluate.